 Catalogo de metadatos del IGME
Mapa digital: ARCC - Coverage of Arc-Info
Type of resources
Available actions
Topics
Provided by
Years
Formats
Representation types
Update frequencies
status
Scale
-
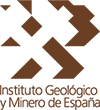
The Geological Map of the Iberian Peninsula, Balearic and Canary Islands or Geological Map of Spain at a scale of 1:1,000,000 is a map developed by the Geological Survey of Spain (IGME) on a cyclical basis since its foundation, being the 1995 version the first to be digitised. This map is an infrastructure of homogeneous and global geological knowledge of a geological unit of continental scale such as the Iberian Peninsula. The map contains the chronolithostratigraphic units with representation of the tectonic structure by means of faults and thrusts. It is also accompanied by two chronolithostratigraphic legends (Peninsula and Balearic and Canary Islands) and the conventional signs. Each of the geological units has an associated description, the dominant rock types and the chronostratigraphic age with precision down to the Flo, when available. There is no difference between the contacts of the map units, all of them being considered as lithological contacts, with the exception of those that are the product of faults. The map is consistent with a topographic base at a scale of 1:1,000,000 prior to the BCN 1000 of the IGN, which is only available in paper format. The geological information on the Iberian Peninsula and the Balearic Islands is in UTM projection, zone 30, Postdam datum. The information on the Canary Islands is in UTM projection, zone 28, datum Pico de las Nieves. The map is distributed free of charge in shape format through the IGME website.
-
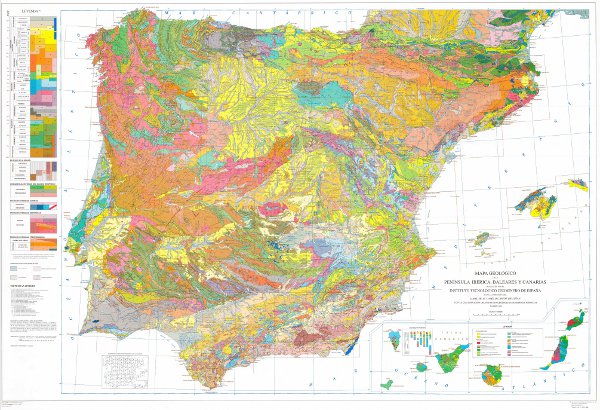
Map showing the geological units classified according to chronostratigraphic and lithological criteria from the point of view of mineral resources. Each cartographic unit has an associated description and geological age. The geological and tectonic structure is represented by faults, thrusting and folding structures. This map, which covers the entire province of Castellón, has been drawn up by the Geological Survey of Spain as part of the "Basic Master Plan for the Natural Mineral Resources of the Valencian Community", the result of the Singularised Collaboration Agreement between the Department of Industry and Commerce of the Valencian Regional Government and the IGME in the field of research and management of the natural mineral resources of the Valencian Community. The agreement was signed in 2000, and work began that same year. The geological mapping of the province of Castellón was completed in 2002. It was carried out using the existing geological cartography of the Geological Map of Spain at a scale of 1:50,000, MAGNA, and the available geological cartography at a scale of 1:200,000. The information is in coverage format (ESRI) and is made up of a file with the cartographic units, contacts and faults, a file with the folding structures, a file with the lithostratigraphic legend and a file with the conventional geological symbols. The geological description, the geological age and the representation codes of the geological units can be found in three tables.
-
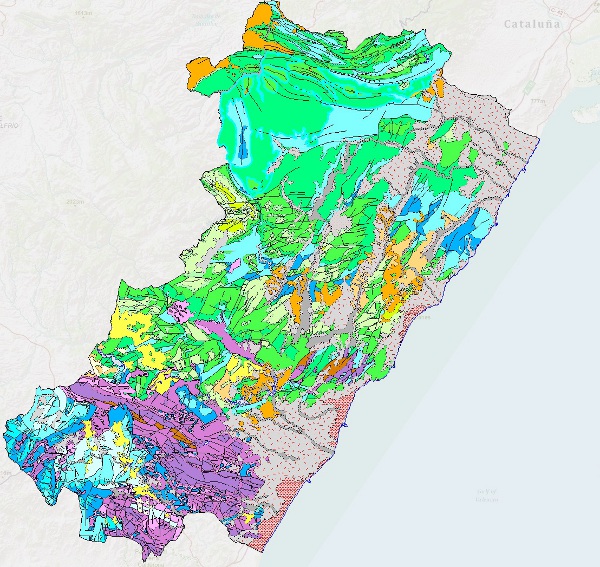
Map showing the geological units classified according to chronostratigraphic and lithological criteria from the point of view of mineral resources. Each cartographic unit has an associated description and geological age. The geological and tectonic structure is represented by faults, thrusting and folding structures. This map, which covers the entire province of Valencia, has been drawn up by the Geological Survey of Spain as part of the "Basic Master Plan for the Natural Mineral Resources of the Valencian Community", the result of the Singularised Collaboration Agreement between the Department of Industry and Commerce of the Valencian Regional Government and the IGME in the field of research and management of the natural mineral resources of the Valencian Community. The agreement was signed in 2000, and work began that same year. The geological mapping of the province of Valencia was completed in 2002. It was carried out using the existing geological cartography of the Geological Map of Spain at a scale of 1:50,000, MAGNA, and the available geological cartography at a scale of 1:200,000. The information is in coverage format (ESRI) and is made up of a file with the cartographic units, contacts and faults, a file with the folding structures, a file with the lithostratigraphic legend and a file with the conventional geological symbols. The geological description, the geological age and the representation codes of the geological units can be found in three tables.
-
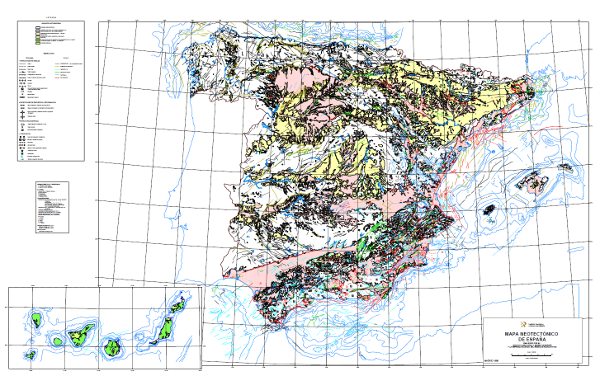
The Neotectonic Map expresses those structural, morphological, stratigraphic and other features that show relatively recent movements (from the period considered neotectonic), as well as the type of stress to which the peninsula is subjected. Its objectives are to identify deformations from the Middle Miocene - Upper Miocene boundary to the present day. The materials have been classified into six categories, two for volcanic materials differentiated by age; and four for the rest of the materials, with four subdivisions according to age. It also includes tectonic structures, stress and deformation directions, diapiric structures and other related phenomena, all with age expression. The map contains information on the Spanish continental shelf. This map, of national scope, has been produced by the Geological Survey of Spain in collaboration with the National Radioactive Waste Company (ENRESA).
-
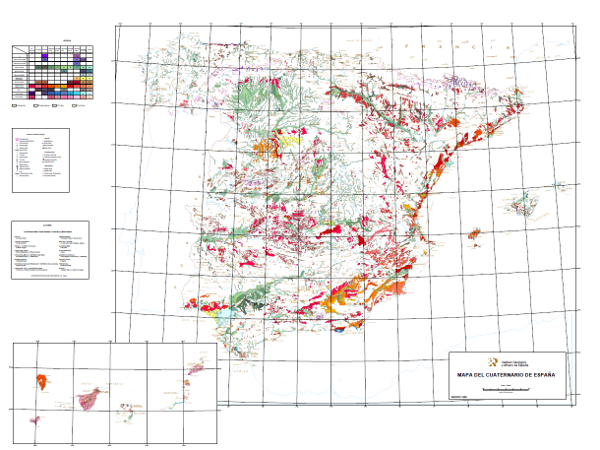
This 1:1,000,000 scale map shows the Plio-Pleistocene to contemporary deposits classified in 10 geochronological intervals and separated according to their genesis. It also includes glacial, volcanic, karstic, aeolian, coastal, edaphic, palaeontological and prehistoric phenomena. It has been carried out by the Geological Survey of Spain (then called the GeoMining Technological Institute of Spain) with the collaboration of experts mainly from the academic world and public research centres. It covers the entire national territory, including the archipelagos, with the exception of Melilla.
-
This Map depicts the materials or rocks that appear on the surface of the sheet, their spatial distribution, nature and geometrical relationships. The cartographic units are chronostratigraphic groupings, with common lithology and age formed by strata which are called formations, groups or members; other non-stratified ones such as granites are represented. The structural relationships between them are expressed by symbols, which gives the map a three-dimensional character that is completed by additional geological profiles. These are the graphic expression of the deep geometrical arrangement of the units shown on the geological map. Applied information such as water points, mineral deposits and indications, presence of fossils and other elements of punctual representation are added by means of symbology. The digital information, geological map 1:100.000, chronolithostratigraphic legend and legend of geological symbols, is stored in coverage format (ESRI). There is a guide that reflects its organisation and codification. The creation of this cartography is based on the compilation of existing information, mainly MAGA cartography at a scale of 1:50,000, doctoral theses and other research work.
-
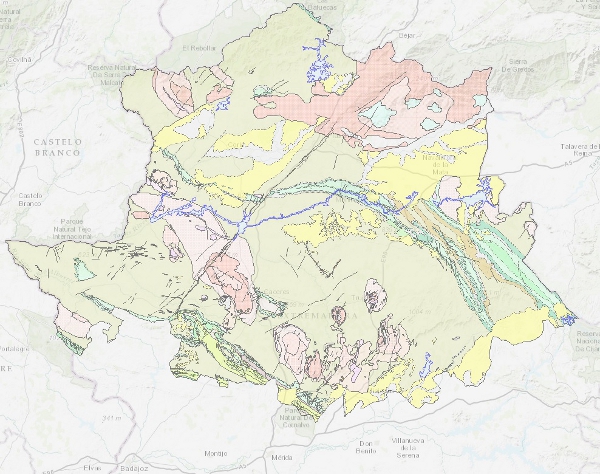
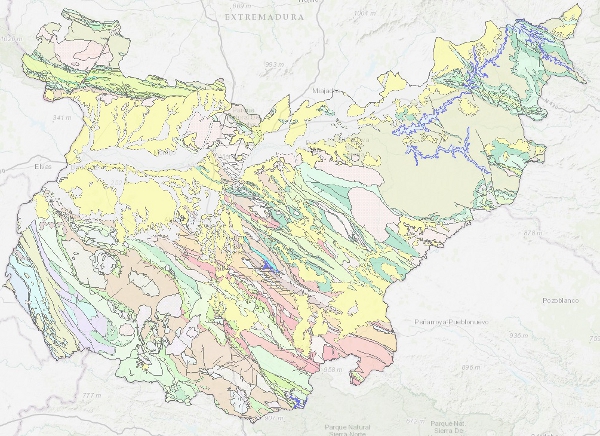
Map with the chronolithostratigraphic and igneous units of the province of Cáceres grouped together as a support for the mapping of mineral resources in the province. The contacts between the different cartographic units have been classified as "stratigraphic contact" and "intrusive contact". The tectonic structure is expressed by faults.
-
Map with the chronolithostratigraphic and igneous units of the province of Badajoz grouped together as a support for the mapping of mineral resources in the province. The contacts between the different cartographic units have been classified as "stratigraphic contact" and "intrusive contact". The tectonic structure is expressed by faults.
-
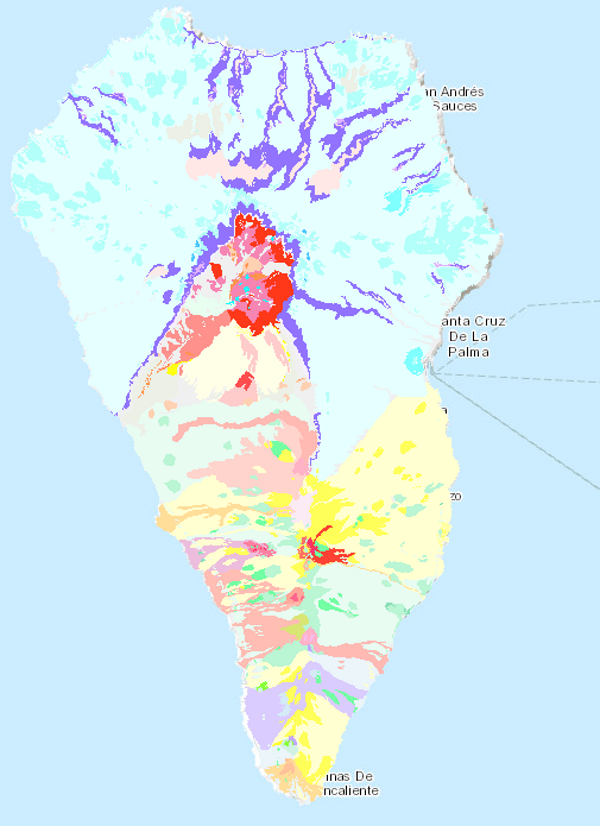
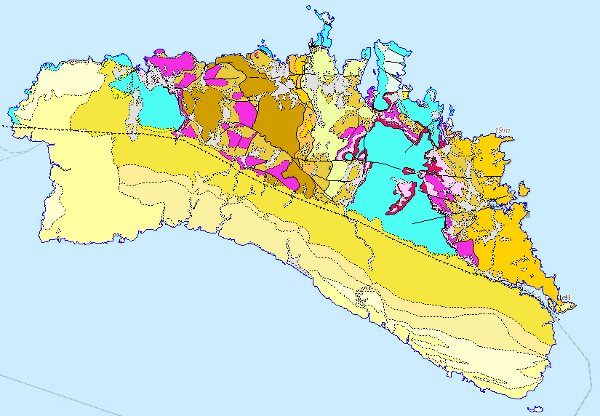
The map of the island of La Palma includes volcanic and sedimentary units separated by different types of contacts: undifferentiated between formations, between lava flows of the same formation and intrusive. The different units have been grouped into different categories according to their genesis, structure and arrangement, such as eruptions, edifices or volcanoes. The direction of the flow lava flows is shown by means of the corresponding symbology. Tectonic processes are shown as faults and recent local features as active slumps. Additional information includes mineral deposits and indications, archaeological sites and other volcanic elements of specific representation. The map is accompanied by the chronolithostratigraphic legend and conventional signs.
-
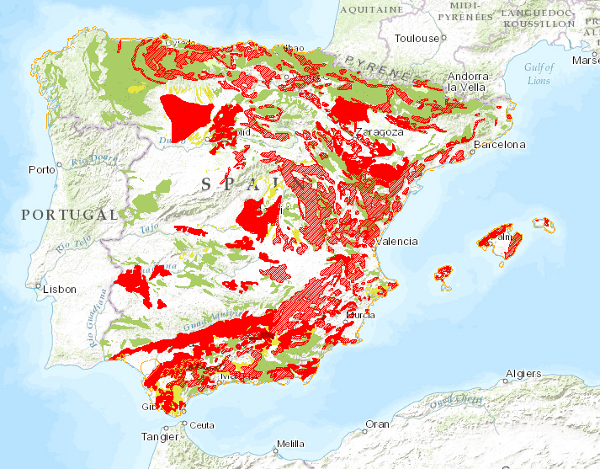
Map delimiting the areas with different types of land movements, representing the most intense and frequent movements. It therefore shows the distribution and extent of the most problematic areas from a practical point of view. Land movements are classified into four main groups: horizontal component movements (landslides and landslides), vertical component movements (subsidence and subsidence, and expansive clays), unstable processes in coastal areas and movements related to mining operations. Areas with significant erosion processes are also included. This map, published in 1987, was drawn up entirely by staff of the Geological Survey of Spain in response to the need for information on geological hazards and risks on a national scale.